
Fil:DT fusion rxnrate.svg

Størrelse for denne PNG-forhåndsvisningen av denne SVG-filen: 360 × 324 piksler Andre oppløsninger: 267 × 240 piksler | 533 × 480 piksler | 853 × 768 piksler | 1 138 × 1 024 piksler | 2 276 × 2 048 piksler.
Opprinnelig fil (SVG-fil, standardstørrelse 360 × 324 piksler, filstørrelse: 12 KB)
| Denne filen er fra Wikimedia Commons og kan brukes av andre prosjekter. Informasjonen fra filbeskrivelsessiden vises nedenfor. |
Beskrivelse
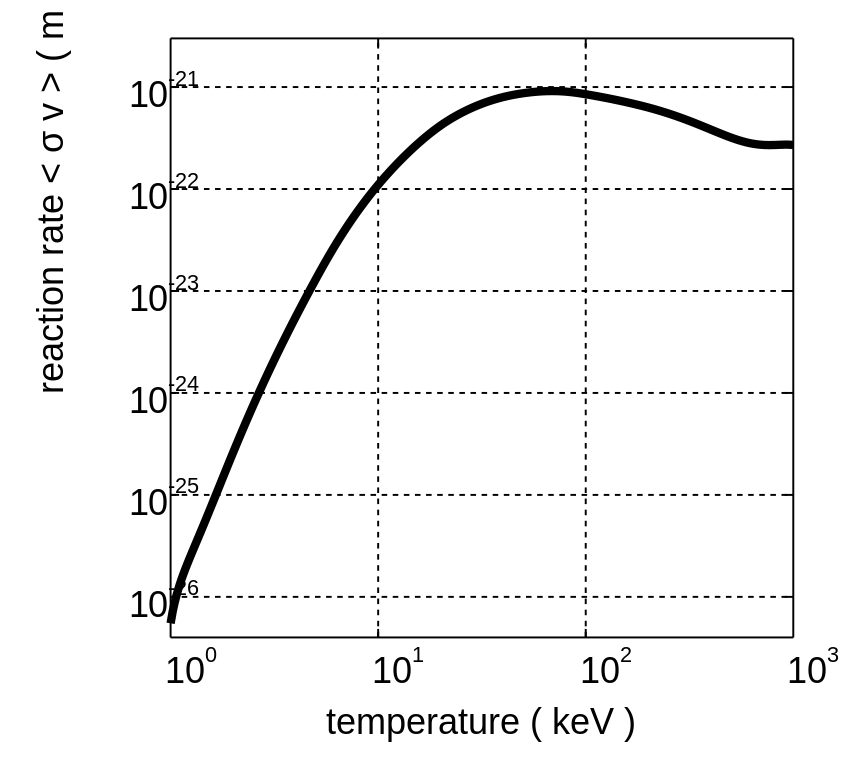
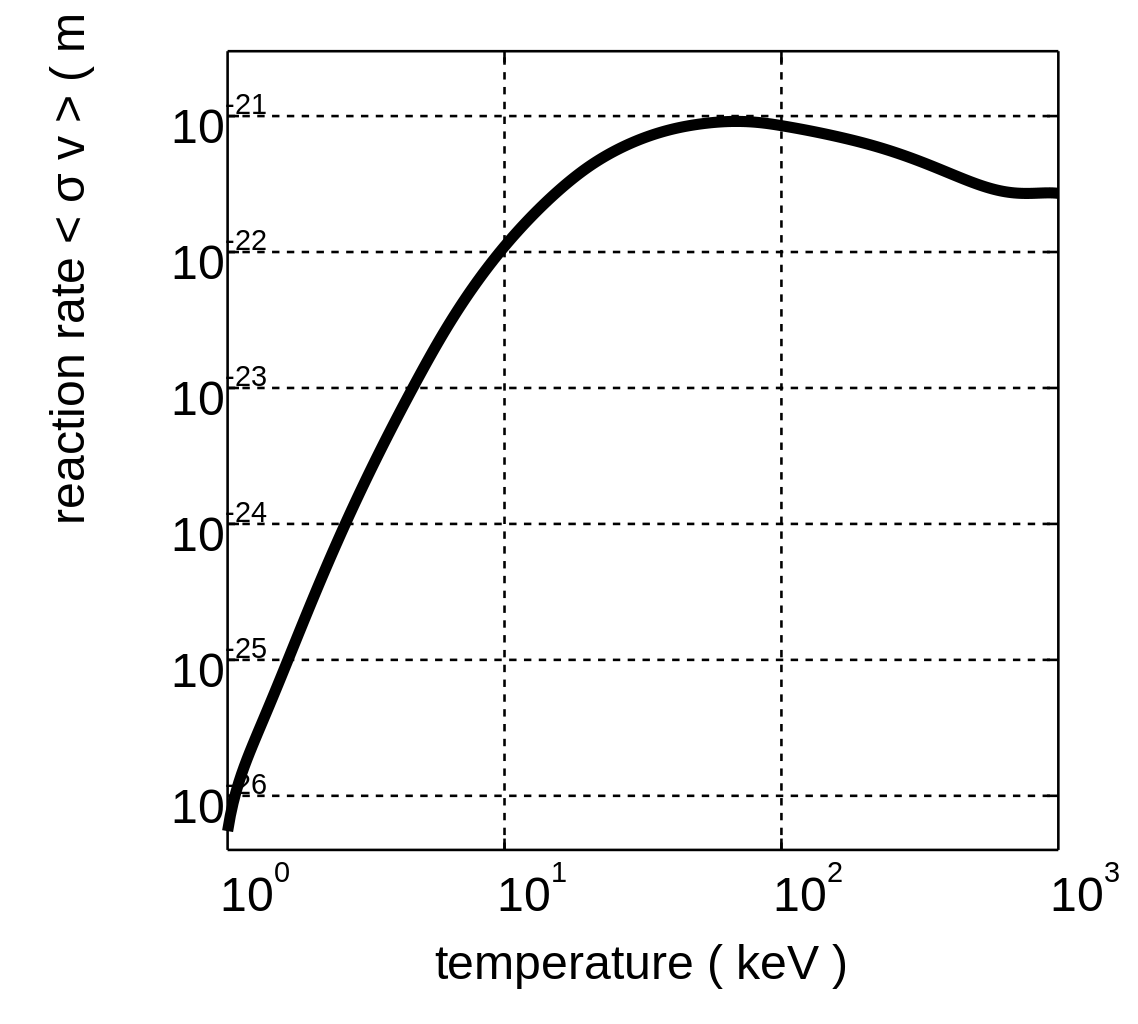
Logarithmic plot of the deuteron-triton fusion reaction rate <σv>, for Maxwellian ion velocity distributions with the same temperature. Created on 10 December 2005 by David Strozzi using Matlab. The curve is a spline interpolation through the data points included on p. 45 of the 2000 revision of the "NRL Plasma Formulary."
Lisensiering
Denne filen er lisensiert under lisensen Creative Commons Navngivelse-DelPåSammeVilkår 2.5 Generisk
- Du står fritt:
- til å dele – til å kopiere, distribuere og overføre verket
- til å blande – til å endre verket
- Under de følgende betingelsene:
- navngivelse – Du må kreditere verket på passende vis, lenke til lisensen og indikere hvorvidt det har blitt gjort endringer. Du kan gjøre det på enhver rimelig måte, men ikke på en måte som antyder at lisensgiveren støtter deg eller din bruk av verket.
- del på samme vilkår – Dersom du remikser, omarbeider eller på annen måte bygger på dette verket, må du kun distribuere resultatet under den samme eller en samsvarende lisens som denne.
Filhistorikk
Klikk på et tidspunkt for å vise filen slik den var på det tidspunktet.
| Dato/klokkeslett | Miniatyrbilde | Dimensjoner | Bruker | Kommentar | |
|---|---|---|---|---|---|
| nåværende | 12. des. 2005 kl. 02:15 | | 360 × 324 (12 KB) | Dstrozzi~commonswiki | Logarithmic plot of the deuteron-triton fusion reaction rate <σv>, for Maxwellian ion velocity distributions with the same temperature. Created on 11 December 2005 by David Strozzi using Matlab. The curve is a spline interpolation through the data |
| 11. des. 2005 kl. 00:01 |  | 270 × 234 (12 KB) | Dstrozzi~commonswiki | Logarithmic plot of the deuteron-triton fusion reaction rate <σv>, for Maxwellian ion velocity distributions with the same temperature. Created on 10 December 2005 by David Strozzi using Matlab. The curve is a spline interpolation through the data | |
| 10. des. 2005 kl. 22:19 | 270 × 3 (12 KB) | Dstrozzi~commonswiki | Logarithmic plot of the deuteron-triton fusion reaction rate <σv>, for Maxwellian ion velocity distributions with the same temperature. Created on 10 December 2005 by David Strozzi using Matlab. The curve is a spline interpolation through the data | ||
| 10. des. 2005 kl. 21:52 | 270 × 3 (12 KB) | Dstrozzi~commonswiki | Logarithmic plot of the deuteron-triton fusion reaction rate <σv>, for Maxwellian ion velocity distributions with the same temperature. Created on 10 December 2005 by David Strozzi using Matlab. The curve is a spline interpolation through the data | ||
| 10. des. 2005 kl. 09:24 |  | 512 × 333 (12 KB) | Dstrozzi~commonswiki | Logarithmic plot of the deuteron-triton fusion reaction rate <v>, for Maxwellian ion velocity distributions with the same temperature. Created on 9 December 2005 by David Strozzi using Matlab. The curve is a spline interpolation through the data points i |
Filbruk
Den følgende siden bruker denne filen:
Global filbruk
Følgende andre wikier bruker denne filen:
- Bruk i bs.wikipedia.org
- Bruk i eo.wikipedia.org
- Bruk i es.wikipedia.org
- Bruk i fr.wikibooks.org
- Bruk i hr.wikipedia.org
- Bruk i ko.wikipedia.org
- Bruk i pt.wikipedia.org
- Bruk i sh.wikipedia.org
- Bruk i sr.wikipedia.org