
Fil:Global Temperature Anomaly 1880-2010 (Fig.A).gif
Ingen høyere oppløsning tilgjengelig.
Global_Temperature_Anomaly_1880-2010_(Fig.A).gif (658 × 474 piksler, filstørrelse: 30 KB, MIME-type: image/gif)
| Denne filen er fra Wikimedia Commons og kan brukes av andre prosjekter. Informasjonen fra filbeskrivelsessiden vises nedenfor. |
Beskrivelse
| Beskrivelse |
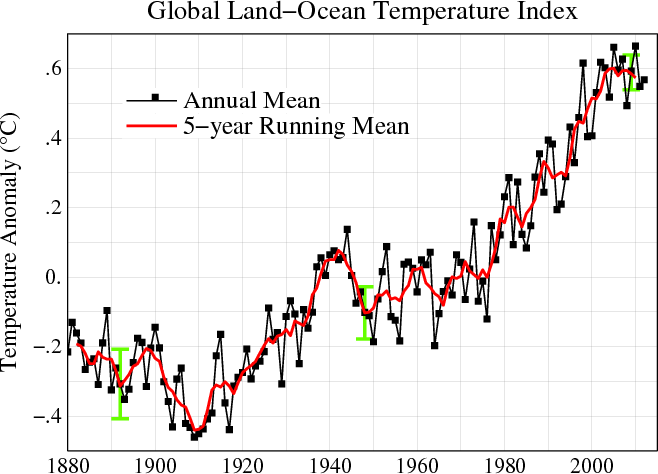
English: Line plot of global mean land-ocean temperature index, 1880 to present, with the base period 1951-1980. The black line is the annual mean and the red line is the five-year running mean. The green bars show uncertainty estimates. [This is an update of Fig. 1A in Hansen et al. (2006).] The graph shows an overall long-term warming trend. |
|||||
| Dato | ||||||
| Kilde | http://data.giss.nasa.gov/gistemp/ | |||||
| Opphavsperson | NASA Goddard Institute for Space Studies | |||||
| Tillatelse (Gjenbruk av denne filen) |
|
|||||
| Andre versjoner |
PDF version: File:Global_Temperature_Anomaly_1880-2010_(Fig.A).pdf. SVG version (1880-2010 data, 1961-1990 base period): File:Instrumental Temperature Record (NASA).svg
|

.gif)
.svg)

|
En vektorversjon av dette bildet (SVG) er tilgjengelig.
Det bør brukes i stedet for punktgrafikkbildet når det er fordelaktig. File:Global Temperature Anomaly 1880-2010 (Fig.A).gif → File:Global Temperature Anomaly.svg
For mer informasjon om vektorgrafikk les Commons transition to SVG. Se også information about MediaWiki's support of SVG images. |
 |
Filhistorikk
Klikk på et tidspunkt for å vise filen slik den var på det tidspunktet.
| Dato/klokkeslett | Miniatyrbilde | Dimensjoner | Bruker | Kommentar | |
|---|---|---|---|---|---|
| nåværende | 21. jun. 2013 kl. 17:56 | | 658 × 474 (30 KB) | Nigelj | Upload version that has been updated with 2012 data |
| 19. jan. 2012 kl. 23:20 |  | 652 × 474 (31 KB) | Simplex1swrhs | I have uploaded a new version of the NASA global temperature graph with 2011 data. | |
| 19. mar. 2011 kl. 17:58 |  | 652 × 474 (31 KB) | Simplex1swrhs | Switched back to the NASA GISS "Global Land-Ocean Temperature Index" graph with 2010 data update. {{Information |Description= Line plot of global mean land-ocean temperature index, 1880 to present, with the base period 1951-1980. The dotted black line is | |
| 3. mar. 2011 kl. 22:05 |  | 655 × 439 (30 KB) | OKIsItJustMe | {{Information |Description ={{en|1=Line plot of global mean land-ocean temperature index, 1880 to present, with the base period 1951-1980. The dotted black line is the annual mean and the solid red line is the five-year mean. The green bars show uncert |
Filbruk
Den følgende siden bruker denne filen:
Global filbruk
Følgende andre wikier bruker denne filen:
- Bruk i ar.wikipedia.org
- Bruk i en.wikipedia.org
- Bruk i fr.wikipedia.org
- Bruk i ko.wikipedia.org
- Bruk i vi.wikipedia.org
- Bruk i zh.wikipedia.org
.gif)